


MPAndroidChart Example App
Beschreibung von MPAndroidChart Example App
This is the example / showcase application for the MPAndroidChart chart library / graph library on GitHub: https://github.com/PhilJay/MPAndroidChart
The library this app showcases (MPAndroidChart) is designed to create beautiful visual representations.
The core features of the library include:
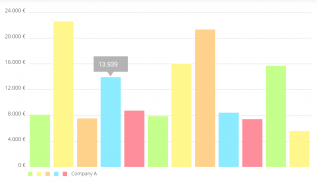
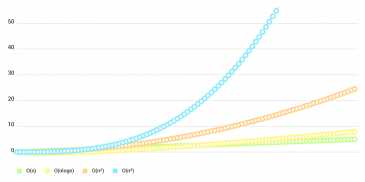
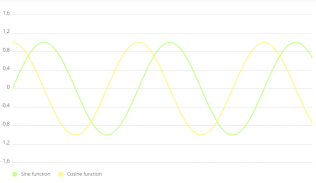
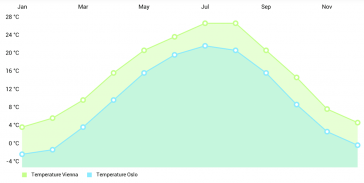
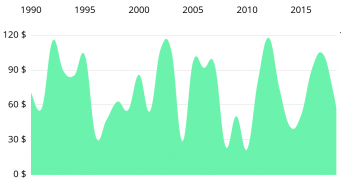
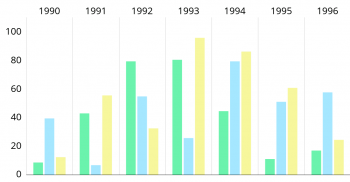
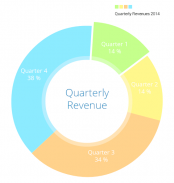
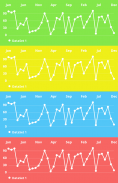
- Many different chart types: LineChart, BarChart (vertical, horizontal, stacked, grouped), PieChart, ScatterChart, CandleStickChart (for financial data), RadarChart (spider web chart), BubbleChart
- Combined Charts (e.g. lines and bars in one)
- Scaling on both axes (with touch-gesture, axes separately or pinch-zoom)
- Dragging / Panning (with touch-gesture)
- Separate (dual) y-axes
- Highlighting values (with customizeable popup-views)
- Save chart to SD-Card (as image)
- Predefined color templates
- Legends (generated automatically, customizeable)
- Customizeable Axes (both x- and y-axis)
- Animations (build up animations, on both x- and y-axis)
- Limit lines (providing additional information, maximums, ...)
- Listeners for touch, gesture & selection callbacks
- Fully customizeable (paints, typefaces, legends, colors, background, dashed lines, ...)
- Realm.io mobile database support via MPAndroidChart-Realm library
- Smooth rendering for up to 10.000 data points in Line- and BarChart (tested on a 2014 OnePlus One running Android 6.0)
- Lightweight (method count ~1.4K)
- Available as gradle dependency and via maven
- Widely used, great support on both GitHub and stackoverflow - mpandroidchart
- Also available for iOS: Charts (API works the same way)
- Also available for Xamarin: MPAndroidChart.Xamarin
This project is meant to demonstrate the features of the library and motivate developers to make use of it. This is not an app to create charts.
Dies ist die Beispiel- / Showcase-Anwendung für die MPAndroidChart-Diagrammbibliothek / Diagrammbibliothek auf GitHub: https://github.com/PhilJay/MPAndroidChart
Die Bibliothek, die diese App präsentiert (MPAndroidChart), wurde entwickelt, um schöne visuelle Darstellungen zu erstellen.
Die Kernfunktionen der Bibliothek umfassen:
- Viele verschiedene Diagrammtypen: LineChart, BarChart (vertikal, horizontal, gestapelt, gruppiert), PieChart, ScatterChart, CandleStickChart (für Finanzdaten), RadarChart (Spinnennetzdiagramm), BubbleChart
- Kombinierte Diagramme (z. B. Linien und Balken in einem)
- Skalierung auf beiden Achsen (mit Touch-Geste, Achsen separat oder Pinch-Zoom)
- Ziehen / Schwenken (mit Touch-Geste)
- Separate (zwei) Y-Achsen
- Hervorheben von Werten (mit anpassbaren Popup-Ansichten)
- Diagramm auf SD-Karte speichern (als Bild)
- Vordefinierte Farbvorlagen
- Legenden (automatisch generiert, anpassbar)
- Anpassbare Achsen (sowohl X- als auch Y-Achse)
- Animationen (Animationen auf X- und Y-Achse aufbauen)
- Begrenzungszeilen (mit zusätzlichen Informationen, Höchstwerten, ...)
- Hörer für Berührungs-, Gesten- und Auswahlrückrufe
- vollständig anpassbar (Farben, Schriften, Legenden, Farben, Hintergrund, gestrichelte Linien, ...)
- Realm.io mobile Datenbankunterstützung über die MPAndroidChart-Realm-Bibliothek
- Glattes Rendering für bis zu 10.000 Datenpunkte in Line- und BarChart (getestet auf einem 2014 OnePlus One mit Android 6.0)
- Leichtgewicht (Methodenzahl ~ 1.4K)
- Verfügbar als Abstufungsabhängigkeit und über Maven
- Weit verbreitete, großartige Unterstützung für GitHub und stackoverflow - mpandroidchart
- Auch für iOS erhältlich: Diagramme (API funktioniert genauso)
- Auch für Xamarin verfügbar: MPAndroidChart.Xamarin
Dieses Projekt soll die Funktionen der Bibliothek demonstrieren und Entwickler dazu motivieren, davon Gebrauch zu machen. Dies ist keine App zum Erstellen von Diagrammen.
MPAndroidChart Example App – Version 3.1.0
(05-07-2020)MPAndroidChart Example App – APK Informationen
APK Version: 3.1.0Paket: com.xxmassdeveloper.mpchartexampleNeueste Version von MPAndroidChart Example App
Weitere Versionen


 4.33
4.33


Apps in derselben Kategorie


Das könnte dir auch gefallen...


